
What did Bitcoin’s “death cross” show? In reporting on November 19, 2026, Decrypt said Bitcoin was trading around $62,640, down 0.6% on the day and roughly 28% below its late-September peak near $87,000. Its daily chart showed the 50-day exponential moving average (EMA) below the 200-day EMA, a crossover Decrypt said had been confirmed that day.
That is an EMA-based death cross. The traditional version uses simple moving averages; EMAs give more weight to recent prices. Both describe a weakening shorter-term trend, not what the price must do next.
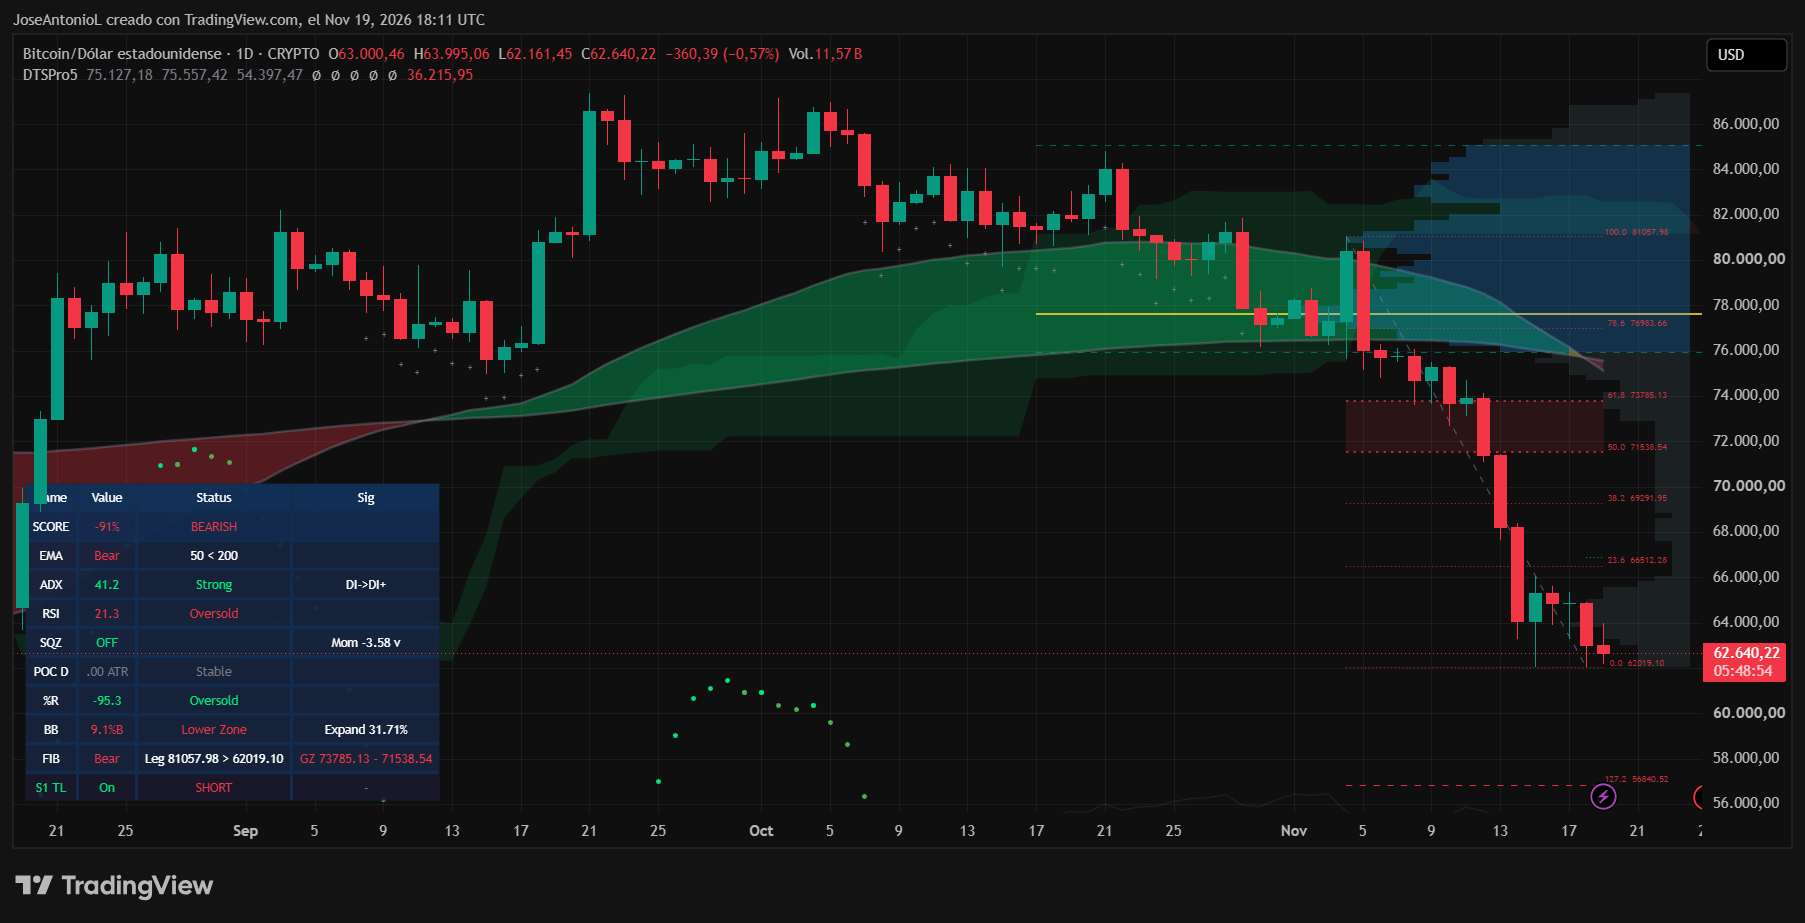
Decrypt reported an RSI reading of 21.3, below the 30 level traders commonly call oversold. That leaves room for a bounce, but does not rule out further losses. Its ADX reading of 41.2 indicated a strong trend; the accompanying directional indicators pointed to sellers having the advantage. The chart placed nearby support around $62,019 and the first recovery level at $66,512.
The weakness was not confined to Bitcoin. Decrypt reported roughly $2.9 billion in outflows from U.S. spot Bitcoin ETFs so far that month, while major U.S. stock indexes fell despite Anthropic’s stock-market debut. Some traders suggested the IPO had drawn money away from crypto, but Decrypt said that explanation was unproven. The crossover describes the selloff already visible in the chart; it cannot establish its cause or predict its end.