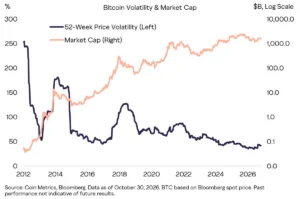
In a report published on November 18, 2026, at 09:20 (+08:00), Bitcoin was trading around $64,000 or lower—about 50% below its high—yet buying after the decline had not clearly recovered. Glassnode estimated that roughly half of circulating Bitcoin was at a paper loss, compared with less than a quarter when Bitcoin closed at $86,600 in late September.
What the loss figure measures
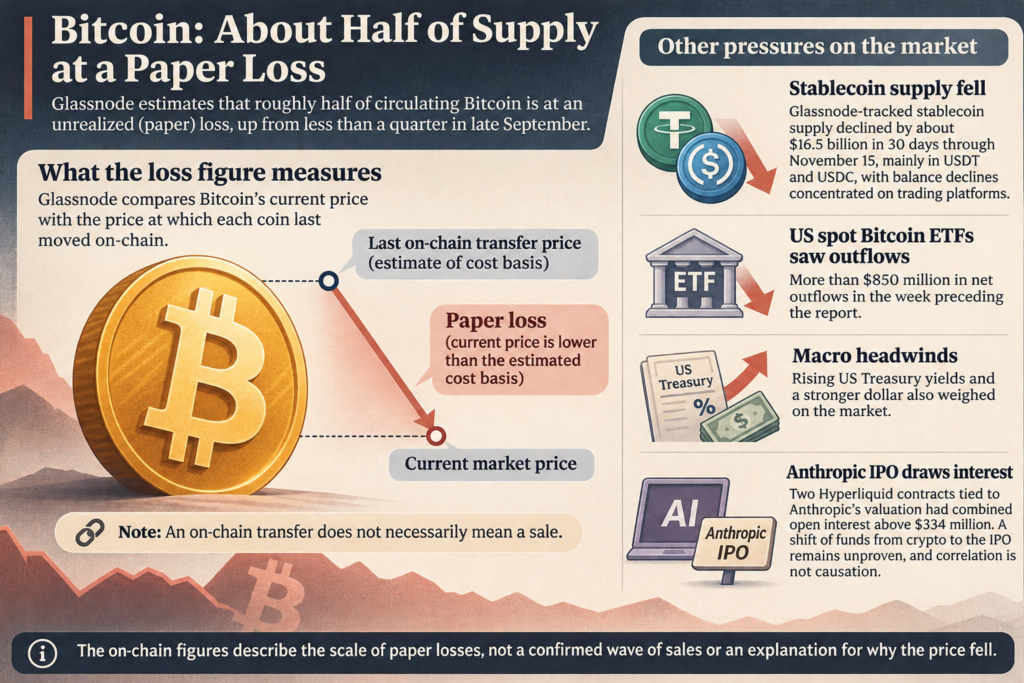
Glassnode compares Bitcoin’s current price with the price at which each coin last moved on-chain. A lower current price indicates a paper loss by that measure. An on-chain transfer does not necessarily mean a sale, so the figure does not show that half of holders have sold at a loss.
For Bitcoin transferred on November 15, the total dollar value of losses measured this way was about 5.6 times that of gains—the widest gap since mid-July. The ratio of short-term to long-term holdings also reached its highest level since late February, while long-term holdings fell by 112,000 BTC over roughly a month.
What else was under pressure?
Glassnode-tracked stablecoin supply fell by about $16.5 billion in the 30 days through November 15, mainly in USDT and USDC, with the balance declines concentrated on trading platforms. US spot Bitcoin ETFs recorded more than $850 million in net outflows in the week preceding the report. Bloomberg said the Bitcoin decline began before forced liquidations over the weekend; rising US Treasury yields and a stronger dollar also weighed on the market.
Interest in a possible shift of funds toward an Anthropic IPO remained unproven. Two Hyperliquid contracts tied to Anthropic’s valuation had combined open interest above $334 million. Some participants had previously traded major cryptocurrency futures, but the available data did not show whether they sold crypto to fund those positions. Binance co-founder Changpeng Zhao listed such a shift as one possible cause of falling crypto prices while stressing that correlation is not causation.
The on-chain figures describe the scale of paper losses, not a confirmed wave of sales or an explanation for why the price fell.